

Fewer Listings, Slower Sales: The Market Slips Into a Deep Freeze
Cotality's November chart pack shows the downturn is now as much about activity as price, with sales volumes down more than 11 per cent, new listings scarce and homes taking longer to sell.
By Estate Guide Online Editorial2 min read
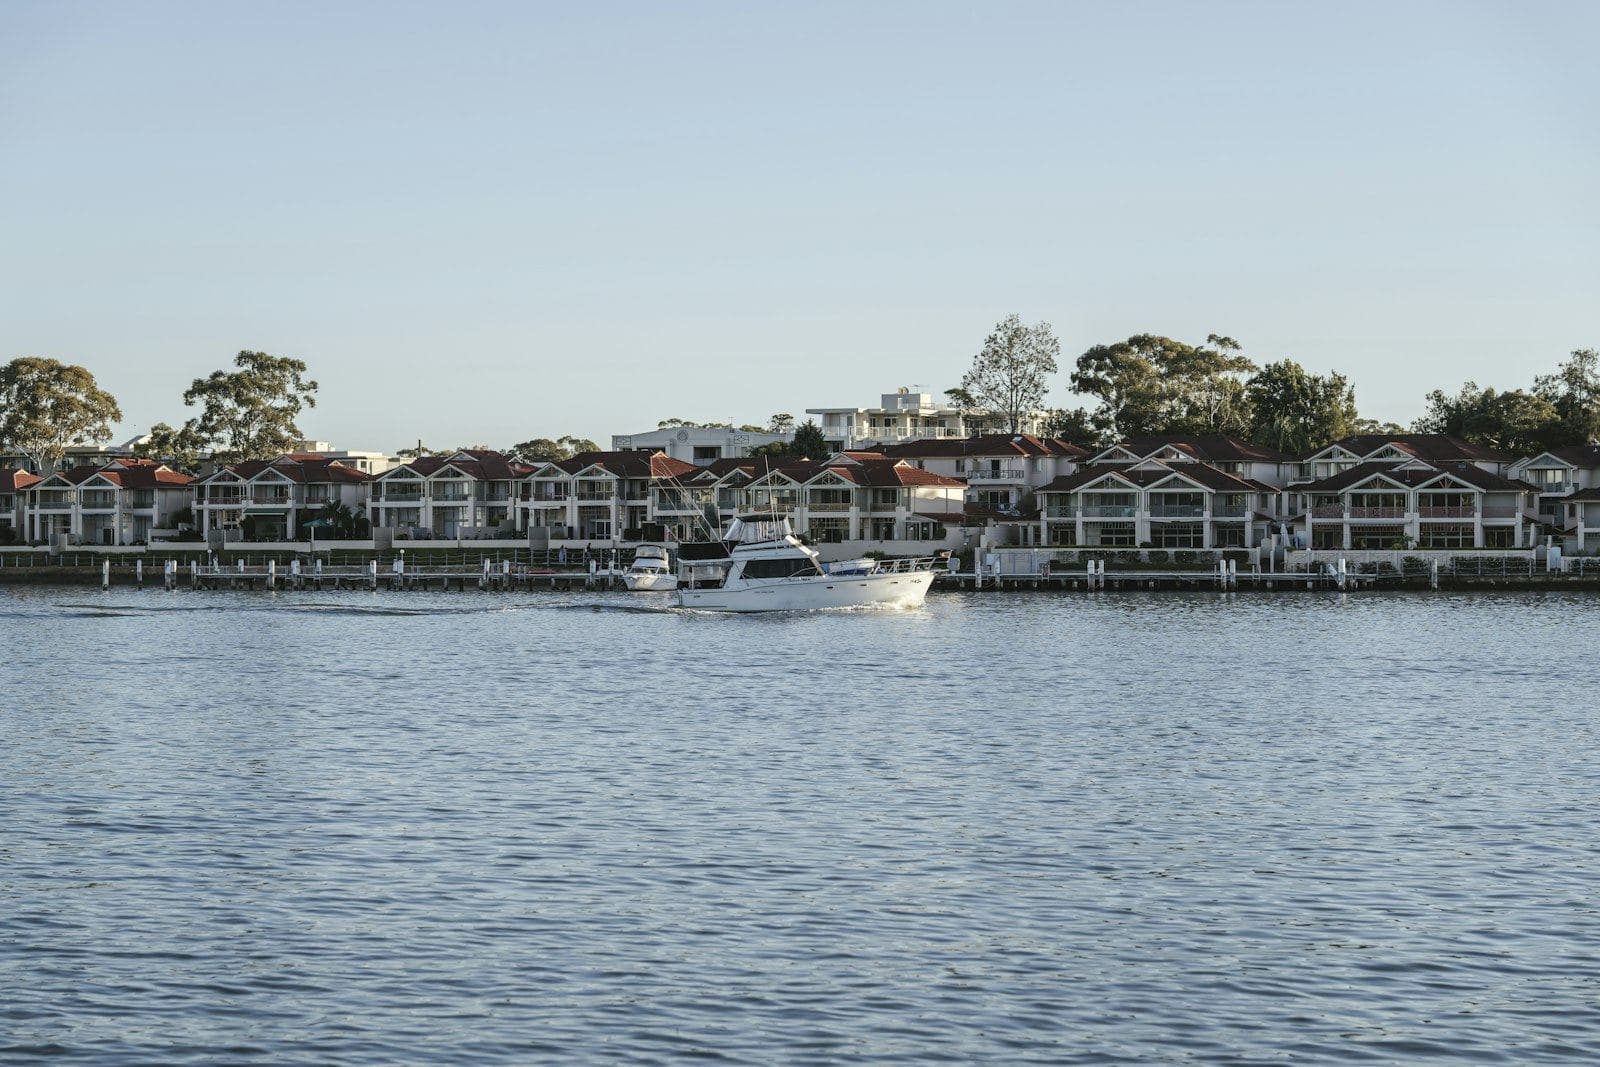
Photo: Nerissa J on Unsplash
The housing correction is no longer only a story about prices. Cotality's Monthly Housing Chart Pack, published on 11 November, shows the market has also seized up on the activity side, with buyers and sellers alike stepping back. National dwelling values fell 3.9 per cent over the three months to October, while combined capital city values are down 8.1 per cent across seven consecutive monthly declines, which the firm describes as the fastest fall in more than four decades.
Behind that headline sits a quieter freeze in transactions. Fewer homes are coming to market, fewer are changing hands, and those that do sell are taking longer to find a buyer.
Sellers are waiting
New listings over the most recent period were 13.9 per cent lower than a year earlier and 15.7 per cent below the five-year average, as owners under no pressure to sell choose to sit tight rather than test a falling market. Yet the homes that are listed are not moving quickly. The national median time on market has stretched to 41 days, a clear lengthening from the brisk conditions of the recent boom, and a sign that vendors and buyers remain some distance apart on price.
Fewer homes for sale would usually mean competition; instead, buyers have the time to wait.
Buyers are hesitating
On the demand side, annual sales volumes are down 11.2 per cent, and auction clearance rates have fallen to their lowest level since May 2020, the depths of the first pandemic shutdown. With borrowing capacity trimmed by five rate rises this year and confidence subdued, would-be purchasers are showing little urgency, and the auction market, usually a barometer of competition, has cooled accordingly.
Where the falls have been deepest
Measured from their respective peaks, the capitals that led the boom have given back the most. Sydney values are 10.1 per cent below peak, Perth 8.9 per cent, Brisbane 8.3 per cent and Melbourne 7.8 per cent, while Adelaide, at 4.4 per cent, has proved more resilient. Regional markets are down a more modest 3.1 per cent, continuing a pattern in which smaller markets have held up better than the cities through the adjustment.
What it means for buyers and owners
A market this quiet rewards preparation on both sides. For buyers, longer selling campaigns and weaker competition create room to assess a home properly and to negotiate, particularly where a vendor genuinely needs to transact. For owners, scarce listings are no guarantee of a quick sale: in Sydney's prestige pockets, well-presented homes in sought-after streets continue to attract committed buyers, but the deciding factor is a price set to current conditions, not to the peak. Realistic expectations, more than a scarcity of stock, are what shorten the days a property spends on the market.
Sources
- Monthly Housing Chart Pack, November 2026 — Cotality
This article is general editorial commentary, not financial or property advice. Figures are drawn from the published sources above and were current at the time of writing.
More from the Prestige Series
All states National
Australia
New Home Lending Records Its Largest Quarterly Fall as Investors Retreat
The value of new housing loans dropped 15.5 per cent in the September quarter, the steepest fall since the series began in 2002, with investor borrowing leading the retreat as tax changes and higher rates reshape the market.
3 min read
 National
Australia
Dwelling Approvals Edge Higher as Apartments Offset Weaker House Building
Total dwelling approvals rose 5.1 per cent in September on a surge in unit and townhouse approvals, even as private house approvals fell for the month, ABS figures show.
2 min read
 National
Australia
Home Values Fall a Seventh Month as Brisbane and Perth Lead the Slide
Cotality's national index dropped 1.2 per cent in October, its largest single-month fall of the year, leaving dwelling values 6.7 per cent below their March peak as the correction broadens beyond Sydney.
2 min read